


Breaking Down The Construction Industry - Infographic
Note: It is not clear what the figures for industry revenue and output in this infographic refer to. Construction industry annual output is actually in the order of £100bn, depending the exact measure and index year. See Office for National Statistics for more information.
We have created an infographic showing various statistics within the British construction industry including revenue, employment and business statistics, health and safety statistics and many more. This is a good infographic to read if you are considering a career within the construction industry. The information shown below has been taken from a variety of different sources including the HSE, OBAS, Ibis World and the UK government.
See more Construction industry infographics.

Featured articles and news
Lack of construction careers advice threatens housing targets

CIOB warning on Government plans to accelerate housebuilding and development.
Shelter from the storm in Ukraine

Ukraine’s architects paving the path to recovery.
Market Intelligence update on cold chain condensing units

Cold Chain Southern European Condensing Units market.
A blueprint for construction’s sustainability efforts

Practical steps to achieve the United Nations Sustainable Development Goals.
Timber in Construction Roadmap
Ambitious plans from the Government to increase the use of timber in construction.

ECA digital series unveils road to net-zero.
Retrofit and Decarbonisation framework N9 launched
Aligned with LHCPG social value strategy and the Gold Standard.
Competence framework for sustainability
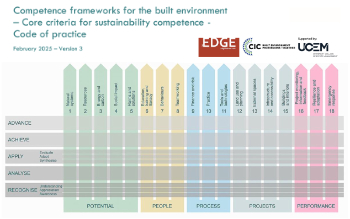
In the built environment launched by CIC and the Edge.
Institute of Roofing members welcomed into CIOB

IoR members transition to CIOB membership based on individual expertise and qualifications.
Join the Building Safety Linkedin group to stay up-to-date and join the debate.
Government responds to the final Grenfell Inquiry report
A with a brief summary with reactions to their response.

A brief description and background to this new February law.

Everything you need to know about building conservation and the historic environment.
NFCC publishes Industry White Paper on Remediation
Calling for a coordinated approach and cross-departmental Construction Skills Strategy to manage workforce development.
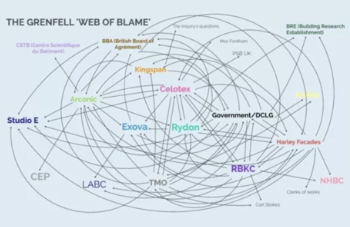
'who blames whom and for what, and there are three reasons for doing that: legal , cultural and moral"
How the Home Energy Model will be different from SAP
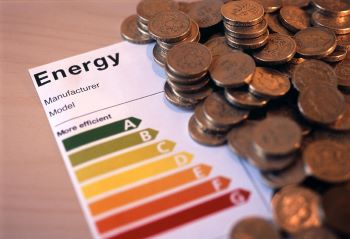
Comparing different building energy models.
Mapping approaches for standardisation.